Three million events.
One solid solution.
With our patented algorithms and extensive database of over 2.0 million disturbances from the power grid, our comprehensive solution is the most effective and informative tool you can find for maintaining grid health and avoiding costly power outages.

The dLab platform
Why use it
Our easy-to-use platform saves your company money and, in most cases, will pay for itself. It also keeps your customers happier and your repair crews safer.
MAIN REASONS TO USE IT:
- Simplifies troubleshooting and reduces number and length of outages, minimizing revenue losses and improving customer satisfaction
- Enables condition-based maintenance through monitoring of key assets in the primary substations
- Brings peace of mind and makes fault investigation more efficient thanks to automated anomaly notifications and analysis reports with access to key data
- Optimize the utilization of grid capacity for improved efficiency.
TYPES OF ISSUES SOLVED:
- Detecting vegetation on overhead power lines
- Finding faulty components
- Identifying unused capacity, bottlenecks and power quality issues in the grid
- Collecting appropriate data for carrying out maintenance
MORE BENEFITS REPORTED BY USERS:
- Better insights into power distribution than with e.g. SCADA
- Quicker overview of the high voltage network
- Can observe the behavior of large consumers
- Excellent support from dLab’s engineers
How it works
1
RECORDS
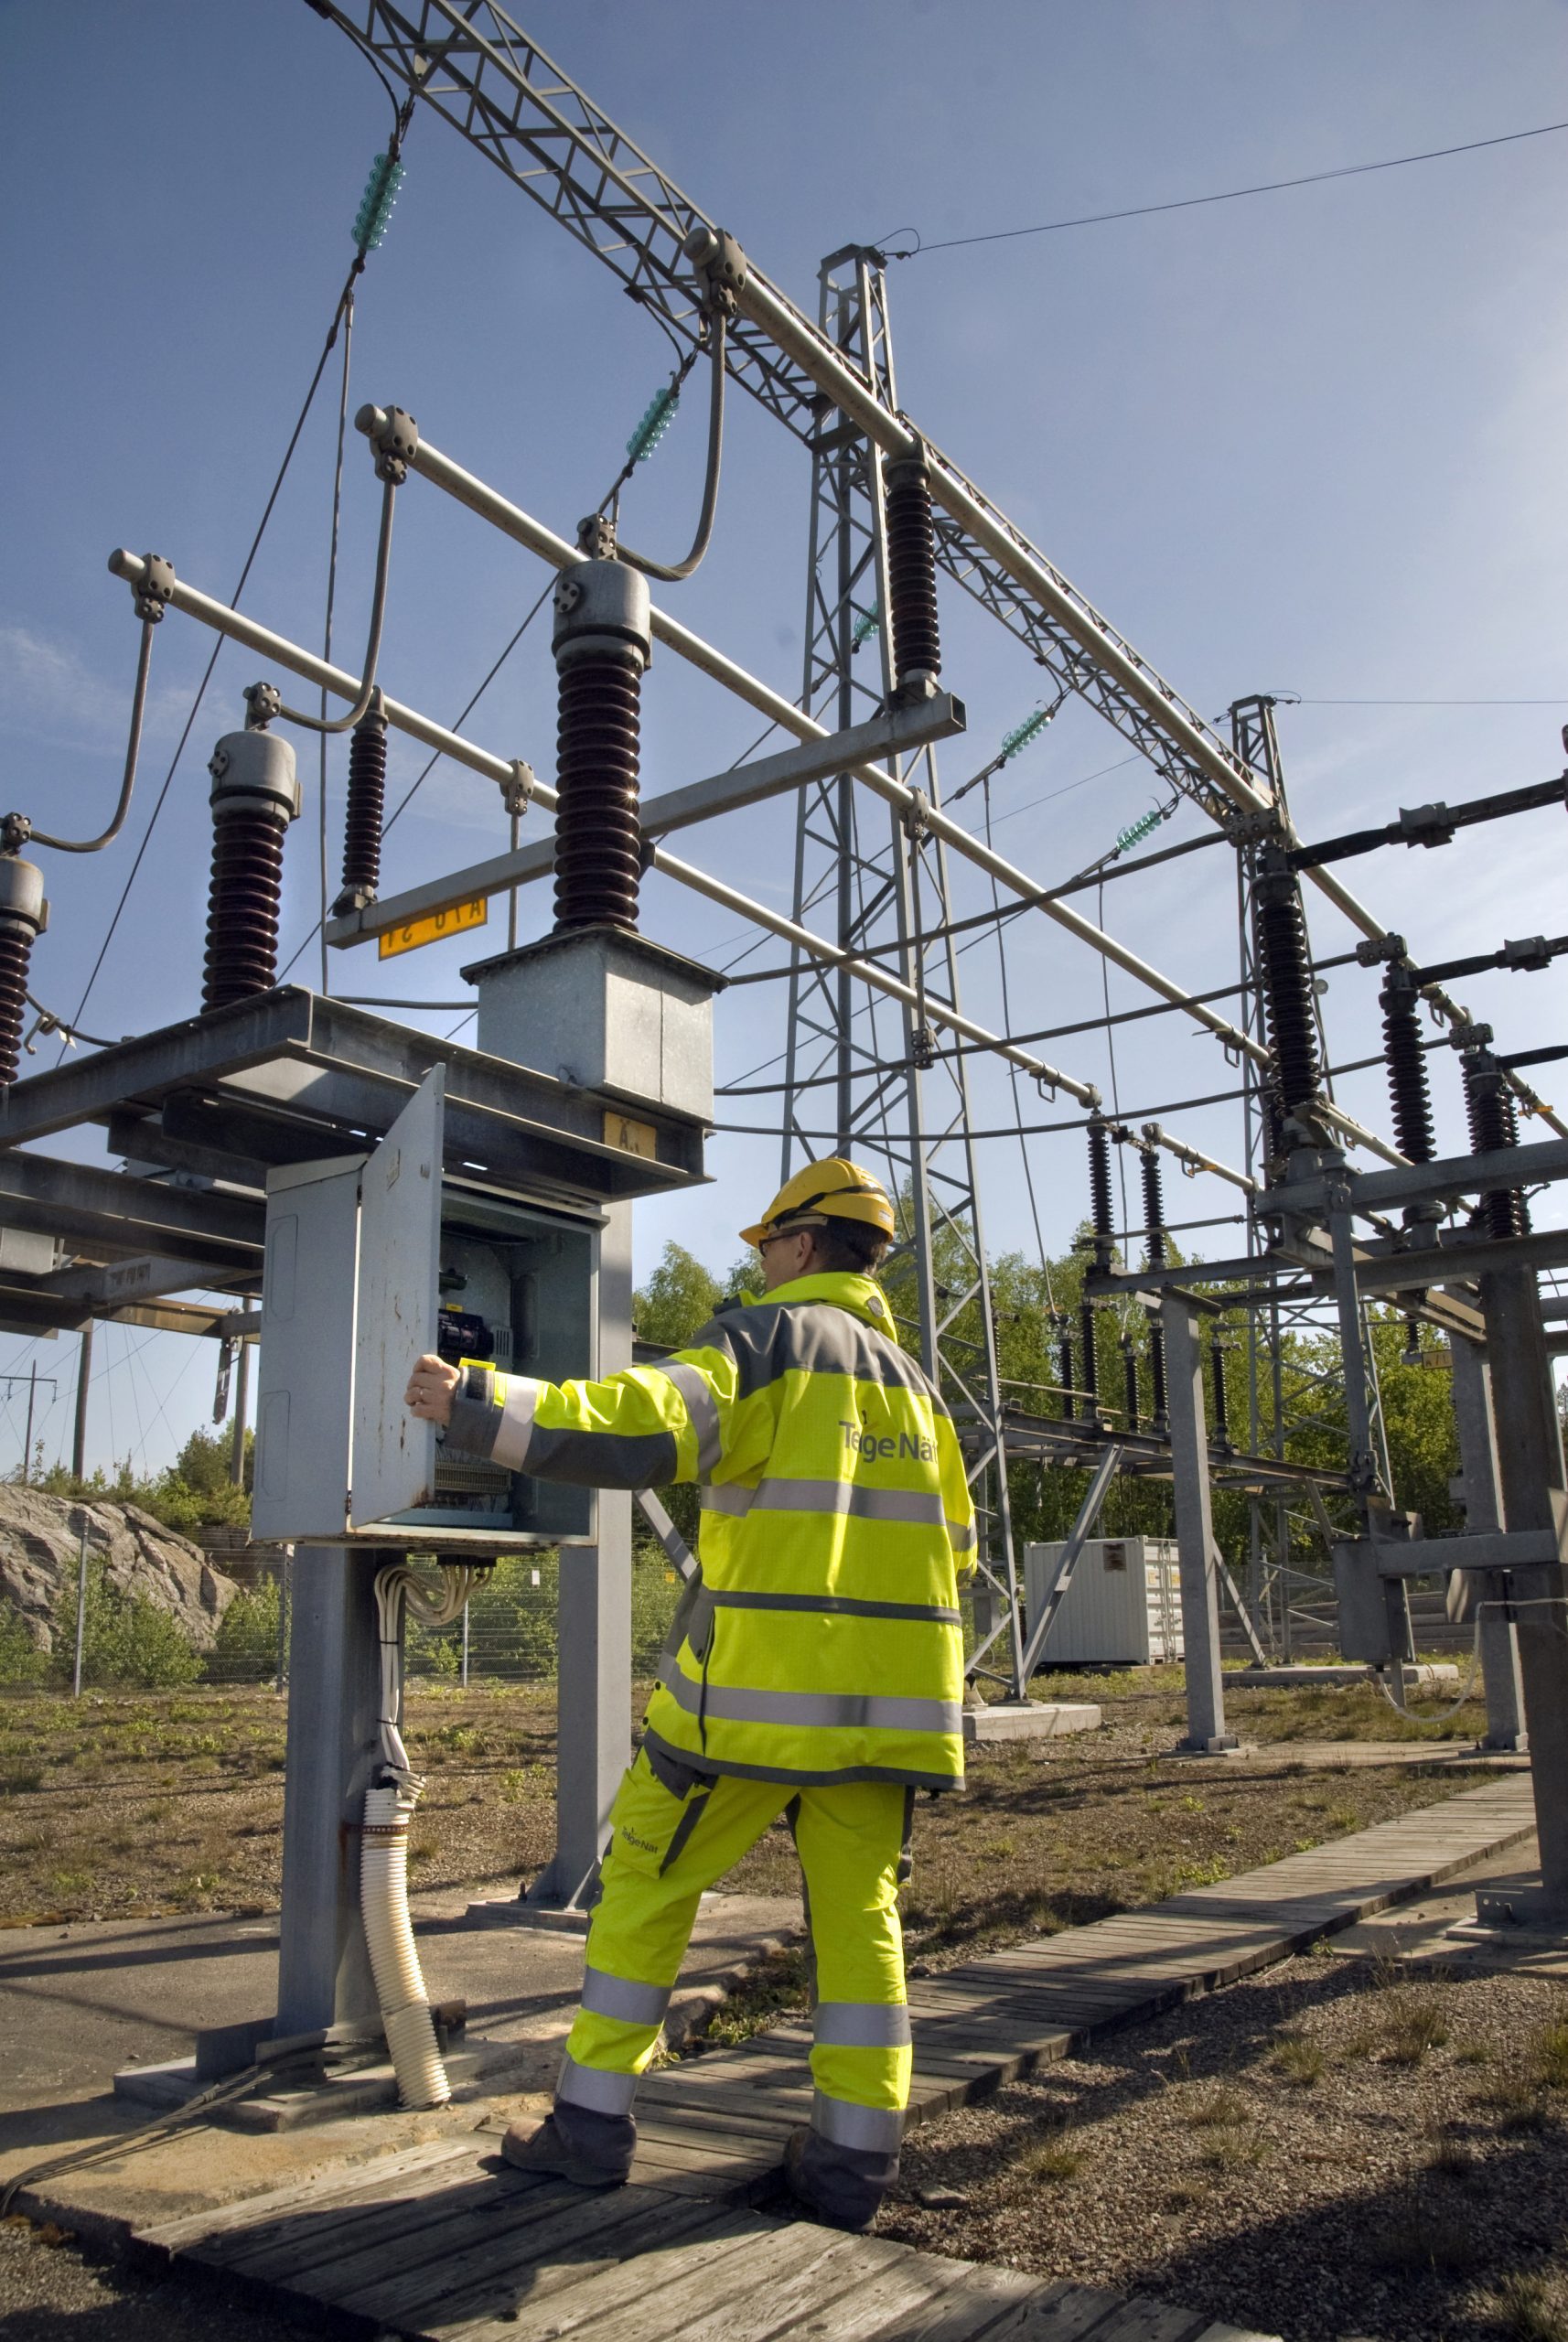
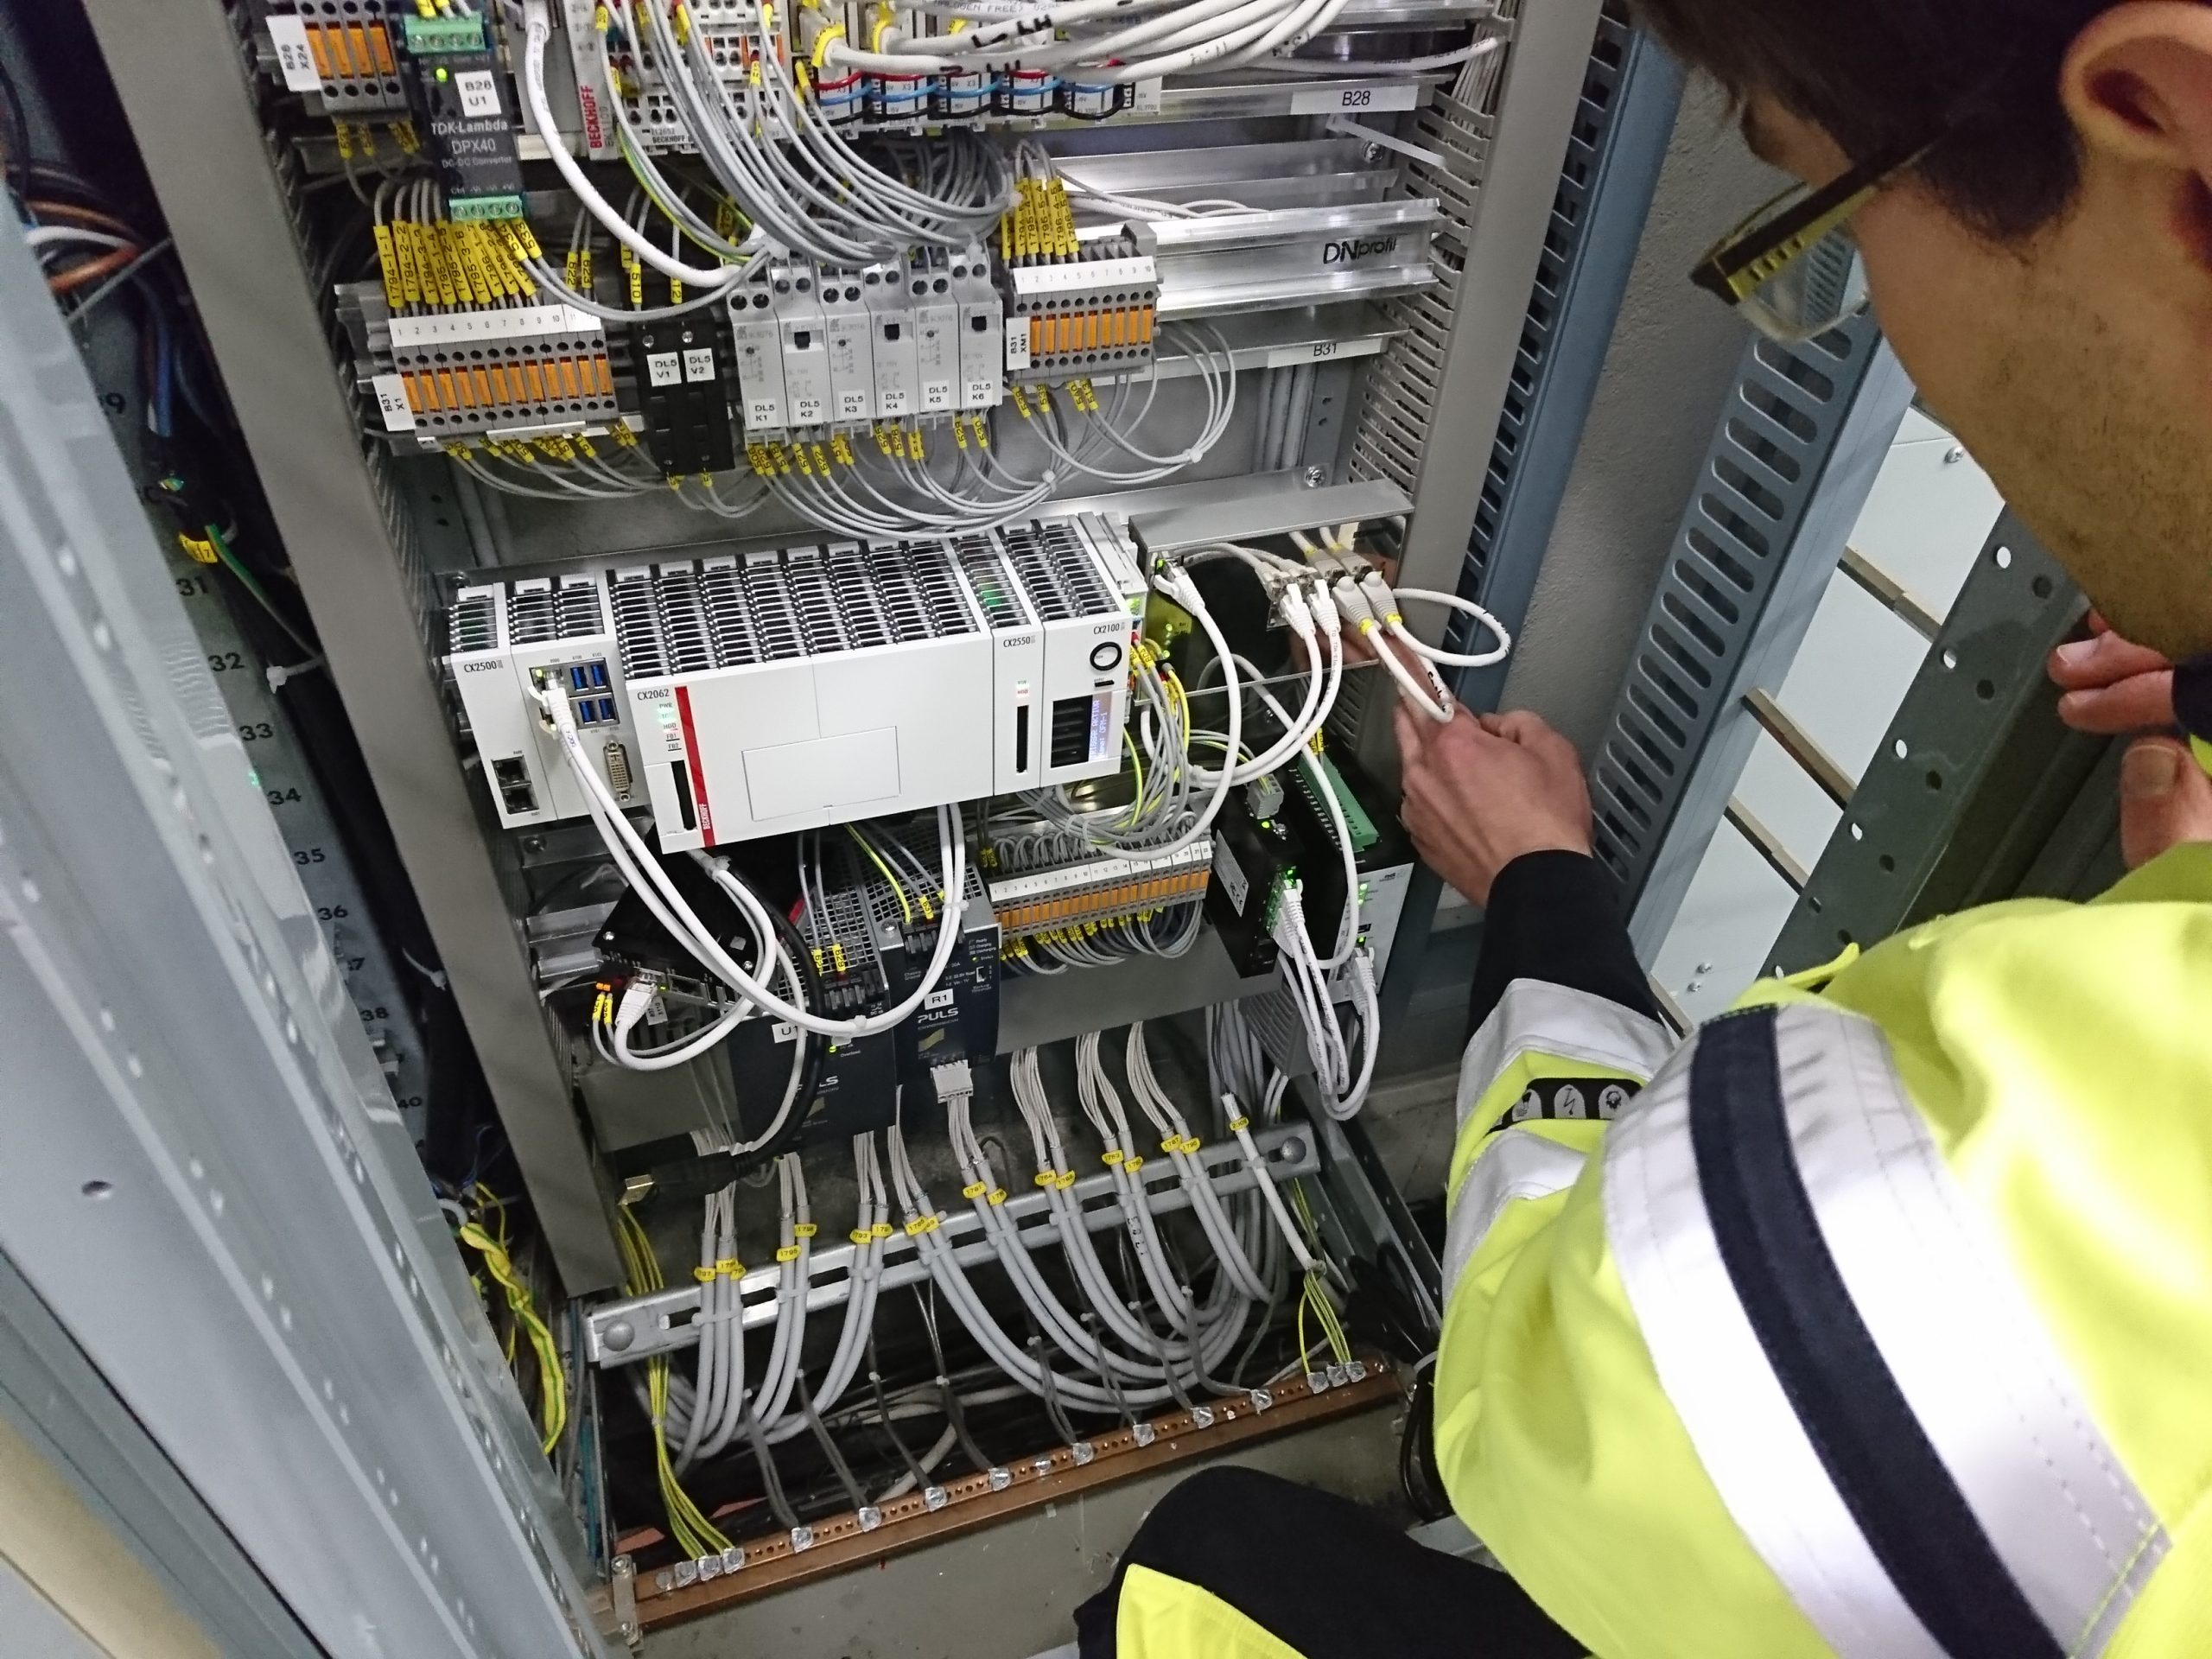
In-depth data beyond what conventional disturbance recorders can pick up is continuously recorded at your substations

2
DETECTS
Using patented algorithms, our software analyses the data for anomalies, power quality issues and overall grid health

3
INFORMS
Notifications for early warnings of disturbances along with a complete overview of loads, power quality and asset status – all presented so you can take action
So you can make better decisions
The platform does the bulk of the work by collecting and analysing data and presenting you with timely alerts, analysis and other KPIs. This enables you to take action based on the valuable insights it delivers.
- Use it proactively to plan maintenance more cost-efficiently
- Solve issues faster thanks to extensive and precise fault data
- Provide safer working conditions for your workers
- Plan new investments with the help of highly reliable data analysis

Read our product brief
Take your first step towards easier and safer decision-making, cost-savings, and day-to-day operations.
An all-in-one solution
The dlab platform comprises a set of advanced tools, all working seamlessly together to bring you the knowledge you need precisely when you need it. Furthermore, it enables communication with other solutions and IT-systems, allowing you to effortlessly import data from various sources. Additionally, it facilitates the smooth export of data and information to other IT systems, such as NIS/GIS or DMS systems.
Analysis Tools
dAnalyzer
Offers grid operators automated, easy to understand analysis and easy to access data for avoiding outages as well as for locating faults and restoring power more quickly. Can also be used for carrying out more extensive disturbance analysis.
dQuality
Full overview of power quality metrics according to standards and of active and reactive power as well as load profiling. A powerful tool assisting network operators in the integration of distributed energy resources, load balancing, etc.
dState
Analyses the wear and tear of assets in the primary substation to enable more intelligent maintenance.
Visualization Tools
dHealth
A patented solution that identifies patterns and trends by analysing how different anomalies and disturbances propagate over time and vary in severity. Automatically assesses your assets in the power grid and creates a Grid Health index. A powerful tool indicating both short-term trends and long-term behaviour.
dInsight
Where a large amount of data is visualized, enabling a quick understanding of the grid’s status, from a complete grid overview down to individual feeders and events. Key Performance Indicators are used to quantify the health status based on deviations and disturbances, enabling more accurate investment need identification.
Services for a smoother digitalization
We understand that digitalization is not just a destination but a journey that requires knowledge-building and support. Our team of experts is here to walk alongside you. Whether you need guidance, consultancy, or hands-on assistance, our dServices are tailored to meet your specific needs.

Get in touch
Connected technology and cutting-edge knowledge makes us who we are. Find out more about the technology behind our solutions and their technical set up.