We are excited to introduce the load duration curve in dQuality, a new feature that enhances the management of peak loads. This feature is available in both the effect and load dashboards in dQuality.
What is a load duration curve?
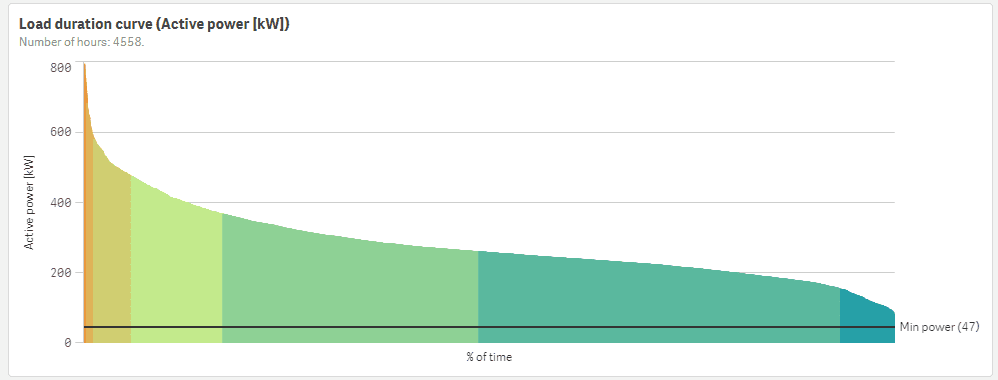
The load duration curve visualizes how frequently and for how long peak loads occur on each outgoing feeder in your substation. This visualization helps identify when and where flexibility services might be needed in your grid.
Why is it important?
The load duration curve gives you a quick overview of load patterns, which can help you plan for periods of high demand or high electricity production. It also allows you to assess the need for flexibility services and optimize their design to avoid potential costs associated with overloads or grid capacity tariffs. By showing how long high loads persist, the curve supports more effective management of your power grid.
If you have any questions about this new feature, don’t hesitate to reach out to us here.